The Art of Science 2.0
Some of the images that I produced as part of a NSF Graduate Research Fellowship project were chosen as part of the ongoing Art of Science Gallery Series in Champaign-Urbana, IL.
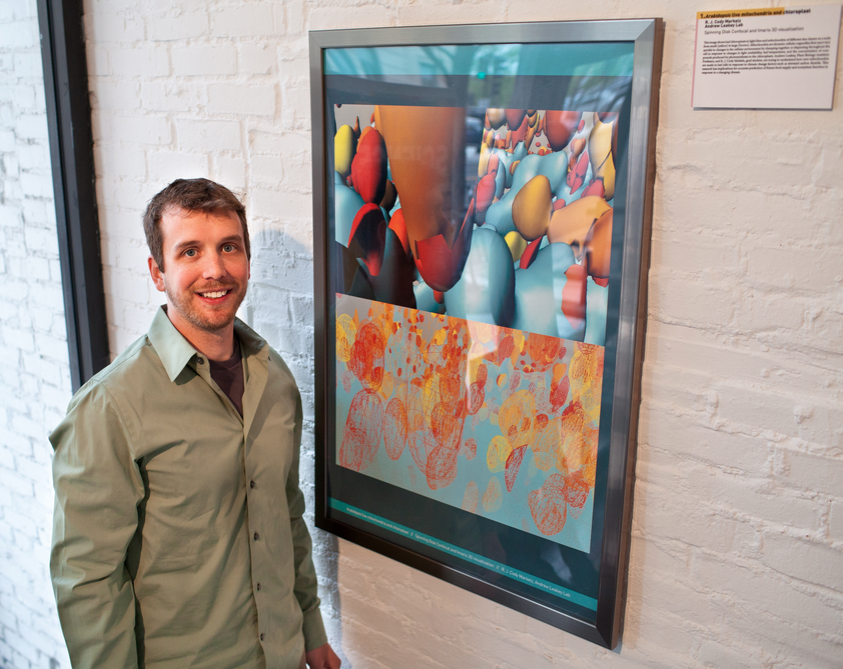
The piece above is titled “Spring growth, fall colors”. The image shows microscopic structures inside a leaf: chloroplasts in light blue, and mitochondria, which convert sugar into forms of usable energy, in a range of colors (yellow to brown) according to their size. Mitochondria react very quickly to changes in the cellular environment by clumping together or dispersing throughout the cell in response to changes in light, temperature, and rate of photosynthesis in the chloroplasts. Research to understand how mitochondria respond to climate change has implications for accurate prediction of future food supply and ecosystem function. The raw data for the image was created using a Spinning Disk Confocal and Imaris 3D visualization Software.
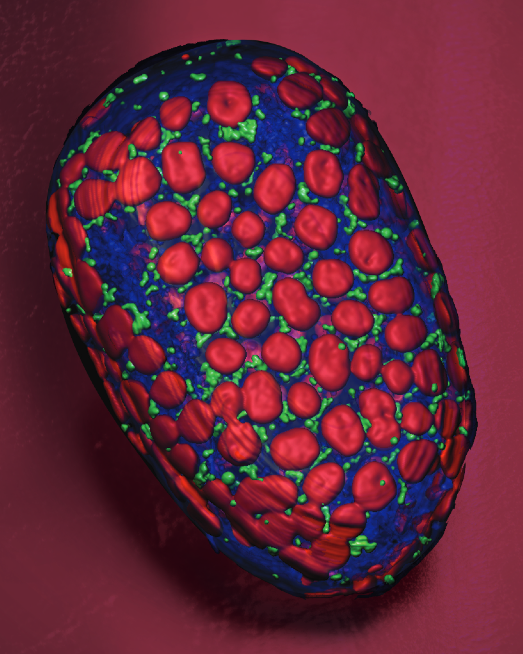
The piece above is titled “Opposing Forces”. By the end of this century, atmospheric CO2 levels are predicted to double. Plants use CO2 to produce sugar during photosynthesis, and release CO2 as they respire. With research that produces images like this one, researchers monitor how increased CO2 changes the balance between photosynthetic and respiratory processes. In the leaf cell shown here, chloroplasts are labeled with red, mitochondria that contribute to respiration are labeled with green, and other fluid inside the cell is labeled with blue. The raw data for the image was captured using a Zeiss LSM 700 Confocal Microscope and Imaris 3D visualization Software.
Explaining complex images like these to a lay audience was a challenge and one of my first adventures in Science Communication.