library(tidyverse)
ski_data <- read.csv("~/DATA/data/SkiTouring.csv")When thinking about how to combine datasets to ask more complex questions it is important to determine where the overlaps in the datasets might be. As an example, The Mount Shasta Avalanche Center keeps records of seasonal weather and avalanche forecast data that I discussed in a previous post. I just made a small movement dataset from some of the ski tours I have done in the Mount Shasta area. Here are just a few summary views of the dataset below. In the next series of posts we will overlap the avalanche forecast data, weather data, and the ski touring movement data based on date, time, elevations, and aspects.
The data set has a number of interesting variables including my movement as I skied, some speed data, some altitude data, and some biometric heart rate data. All of the tours were in the 2019-2020 or the 2020-2021 ski season on the lower slopes of Mount Shasta, Ca.
Take a quick look.
glimpse(ski_data)Rows: 13,491
Columns: 17
$ timestamp <chr> "2020-01-18 18:33:31", "2020-01-18 18:33:58", "2020-01-…
$ position_lat <dbl> 41.35011, 41.35010, 41.35012, 41.35014, 41.35016, 41.35…
$ position_long <dbl> -122.2793, -122.2793, -122.2793, -122.2792, -122.2792, …
$ altitude <dbl> NA, 1504.2, 1504.8, 1504.8, 1505.0, 1505.2, 1505.6, 150…
$ heart_rate <int> NA, 55, 62, 62, 64, 64, 69, 66, 67, 76, 74, 73, 72, 70,…
$ cadence <int> NA, 64, 48, 52, 49, 46, 46, 43, 43, 0, 48, 72, 75, 75, …
$ temperature <int> NA, 24, 25, 25, 25, 25, 25, 25, 25, 25, 25, 25, 25, 25,…
$ distance <int> NA, NA, NA, NA, 7, 9, NA, 15, NA, NA, NA, 24, 26, 29, 3…
$ speed <dbl> NA, NA, NA, NA, 0.5, 0.8, 1.1, 1.1, 0.7, 0.0, 0.0, 1.0,…
$ vertical_speed <dbl> NA, 0.00, 0.02, 0.00, 0.00, 0.00, 0.00, 0.00, 0.04, 0.0…
$ File_Path <chr> "Move_2020_01_18_10_33_29_Ski_touring.fit", "Move_2020_…
$ activity <chr> "SkiTouring", "SkiTouring", "SkiTouring", "SkiTouring",…
$ HRzone <chr> NA, "R", "R", "R", "R", "R", "R", "R", "R", "R", "R", "…
$ datetime <chr> "2020-01-18 18:33:31", "2020-01-18 18:33:58", "2020-01-…
$ year <int> 2020, 2020, 2020, 2020, 2020, 2020, 2020, 2020, 2020, 2…
$ date <chr> "2020-01-18", "2020-01-18", "2020-01-18", "2020-01-18",…
$ seconds <chr> "18:33:31", "18:33:58", "18:34:42", "18:34:45", "18:34:…summary(ski_data) timestamp position_lat position_long altitude
Length:13491 Min. :41.35 Min. :-122.3 Min. :1504
Class :character 1st Qu.:41.36 1st Qu.:-122.2 1st Qu.:1827
Mode :character Median :41.36 Median :-122.2 Median :2052
Mean :41.36 Mean :-122.2 Mean :2031
3rd Qu.:41.36 3rd Qu.:-122.2 3rd Qu.:2262
Max. :41.37 Max. :-122.2 Max. :2532
NA's :8908
heart_rate cadence temperature distance
Min. : 42.00 Min. : 0.00 Min. :12.00 Min. : 7
1st Qu.: 55.00 1st Qu.: 37.00 1st Qu.:19.00 1st Qu.:1640
Median : 71.00 Median : 48.00 Median :20.00 Median :3144
Mean : 76.91 Mean : 49.95 Mean :20.83 Mean :3309
3rd Qu.: 98.00 3rd Qu.: 69.00 3rd Qu.:22.00 3rd Qu.:4668
Max. :148.00 Max. :114.00 Max. :31.00 Max. :9317
NA's :361 NA's :8908 NA's :8908 NA's :10905
speed vertical_speed File_Path activity
Min. :0.00 Min. :-1.180 Length:13491 Length:13491
1st Qu.:0.80 1st Qu.:-0.020 Class :character Class :character
Median :1.00 Median : 0.040 Mode :character Mode :character
Mean :1.48 Mean :-0.021
3rd Qu.:1.40 3rd Qu.: 0.100
Max. :8.40 Max. : 0.240
NA's :8912 NA's :8908
HRzone datetime year date
Length:13491 Length:13491 Min. :2020 Length:13491
Class :character Class :character 1st Qu.:2020 Class :character
Mode :character Mode :character Median :2020 Mode :character
Mean :2020
3rd Qu.:2020
Max. :2021
seconds
Length:13491
Class :character
Mode :character
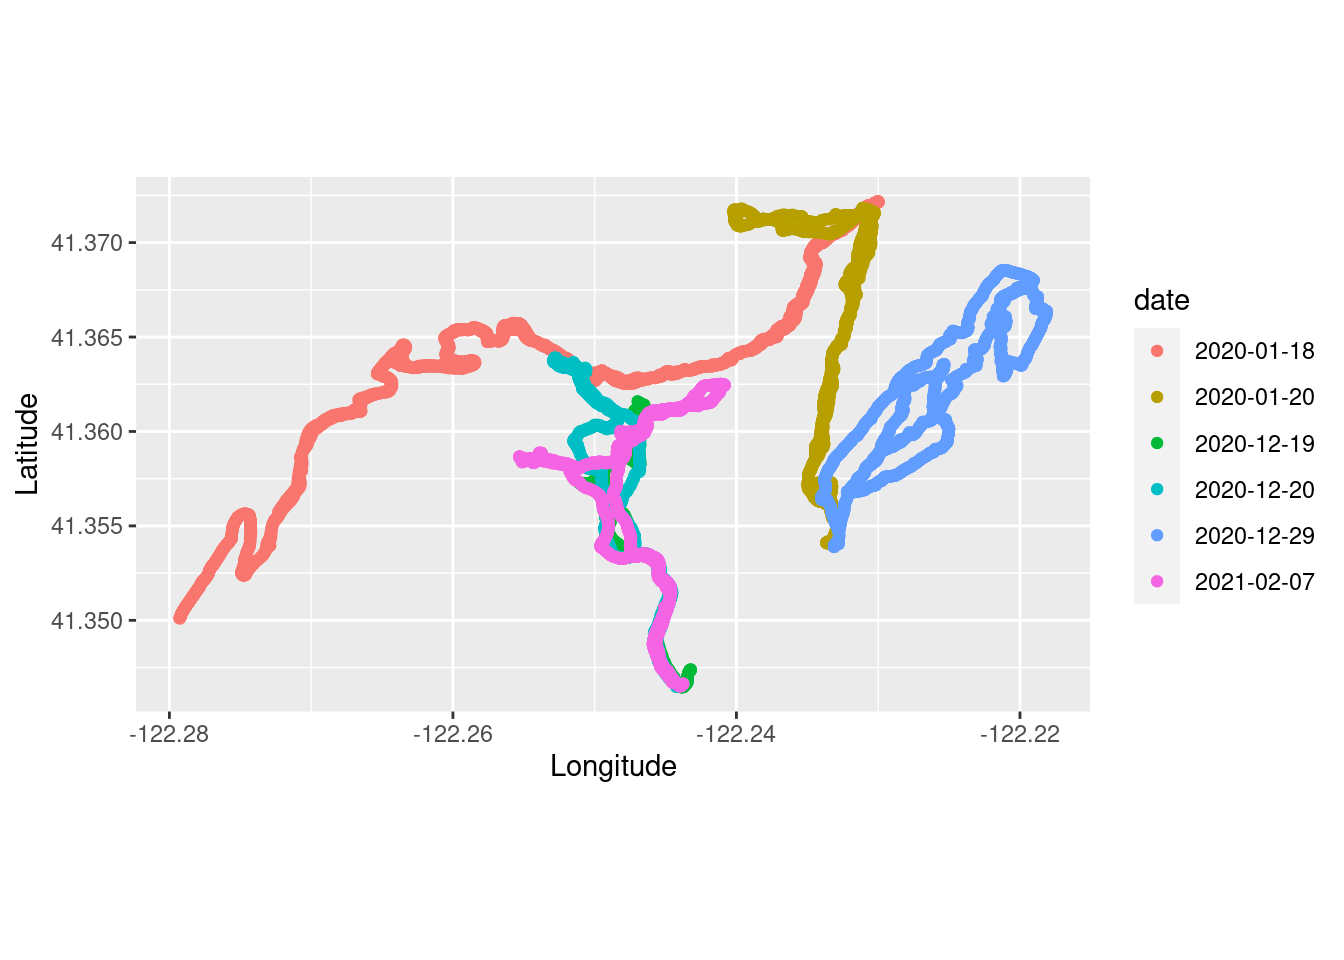
Make a quick plot using the latitude and longitude coordinates and color by the date of the tour.
ski_plot1 <- ggplot(ski_data,
                    aes(x = position_long, y = position_lat, color = date)) +
                    coord_quickmap() + geom_point() +
                    ylab("Latitude") + xlab("Longitude")

ski_plot1